Published Jan 2026
Vietnam’s 2025 Economic Landscape: What the Numbers Reveal and What They Hide
Vietnam posted one of its strongest growth years in over a decade but beneath the headline numbers lie deep structural dependencies, rising risks, and uncomfortable truths the data doesn’t shout about. This is the story behind the growth.

Vietnam’s socio-economic performance in 2025 marked one of the strongest expansions of the past decade, driven by broad-based growth across industry, services, and improving domestic demand—while still reflecting structural features that continue to define Vietnam’s development model, notably high dependence on the FDI export engine, rising investment intensity, and persistent exposure to climate shocks and public health risks. Based on official quarterly and annual indicators, 2025 closed with a notably strong fourth quarter, and the full-year picture shows a rapidly expanding economy with improving productivity, resilient agriculture, a high-growth manufacturing base, surging tourism, and accelerating trade and investment flows.
A high-growth year, led by industry and services
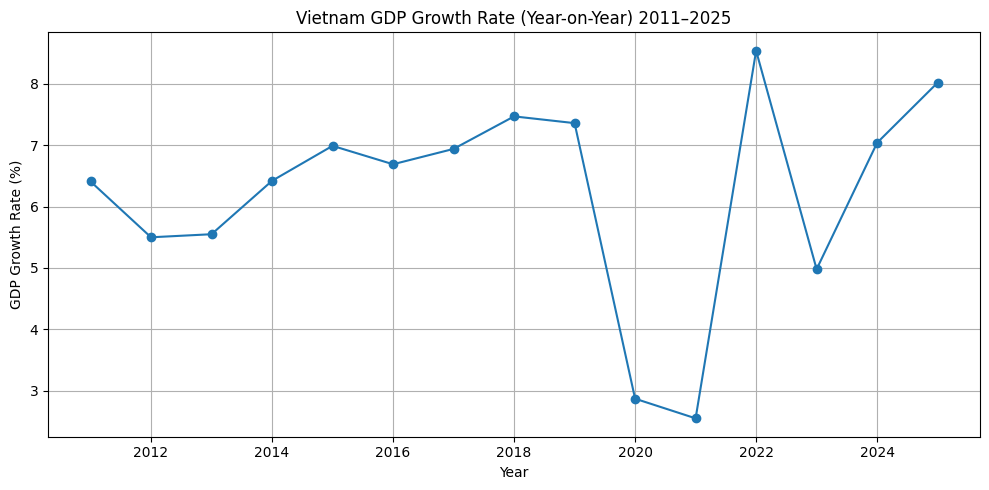
GDP in the fourth quarter of 2025 rose by 8.46% year-on-year, the highest Q4 growth rate during 2011–2025, extending the pattern of each quarter outperforming the previous one. Quarterly growth accelerated from 7.05% in Q1 to 8.16% in Q2, 8.25% in Q3, and 8.46% in Q4, highlighting a strengthening momentum rather than a one-off rebound. The sectoral breakdown in Q4 showed a familiar but healthy pattern: industry and construction expanded by 9.73% and contributed 45.80% of total value-added growth, while services grew 8.82% and contributed the largest share at 49.07%. Agriculture, forestry, and fishing increased 3.70%, contributing 5.13%—smaller in absolute terms but strategically important for food security, rural livelihoods, and inflation containment.
For the full year, GDP growth reached an estimated 8.02%, only slightly below the exceptional post-pandemic rebound year of 2022 within the 2011–2025 period. Services contributed the largest portion of total value-added growth (51.08%), followed by industry and construction (43.62%) and agriculture (5.30%). This composition signals a year in which Vietnam’s growth was not solely “factory-led,” but increasingly supported by consumption, logistics, travel, and commercial services.
On the expenditure side, Q4 GDP dynamics were robust across the board: final consumption rose 7.15%, capital formation increased 8.92%, and both exports and imports of goods and services surged about 19.3–19.4%, underscoring strong external demand and deepening supply-chain integration. For the full year, final consumption grew 7.95%, capital formation rose 8.68%, exports expanded 16.27%, and imports increased 17.12%—a pattern consistent with an economy scaling up production and investment while meeting rising domestic demand.
Economic structure, scale, and productivity improvements
Vietnam’s economic structure in 2025 continued its gradual shift toward services, while industry remained the main growth engine. The sectoral shares were estimated at 11.64% for agriculture, 37.65% for industry and construction, 42.75% for services, and 7.96% for taxes less subsidies on products. Compared with 2024, agriculture’s share eased slightly, while services gained modestly—an expected transition for a rapidly urbanizing and increasingly consumption-driven economy.
The nominal size of the economy reached VND 12,847.6 trillion, equivalent to USD 514 billion, an increase of about USD 38 billion from 2024 (USD 476 billion). GDP per capita rose to VND 125.5 million, equivalent to USD 5,026, up roughly USD 326 year-on-year. These figures indicate not only faster growth but also a larger economic base, improving income levels, and stronger market depth.
Labor productivity also improved meaningfully. At current prices, productivity was estimated at VND 245.0 million per worker (about USD 9,809 per worker), up USD 626 year-on-year. At constant prices, labor productivity increased 6.83%, supported by higher growth, improved workforce qualifications, and expanding economic scale. The share of trained workers with degrees and certificates increased to 29.2%, up 0.8 percentage points from 2024—a key indicator as Vietnam attempts to move up the value chain and reduce dependence on labor-cost advantages alone.
Agriculture’s resilience amid climate shocks and animal disease
Agriculture, forestry, and fishing in 2025 delivered steady growth despite headwinds from storms, floods, and the widespread outbreak of African swine fever. Timely response and recovery measures helped stabilize output and protect supply chains. Value added for the broader sector rose 3.78%, with agriculture up 3.48%, forestry up 5.70% (small weight), and fishing up 4.41%.
Rice production remained stable: total rice area was about 7.13 million hectares, with a yield of 61.1 quintals/hectare, producing 43.5 million tons—a slight increase year-on-year. Total cereal output reached 47.9 million tons, including maize at 4.4 million tons. Seasonal patterns were mixed: winter-spring rice expanded in area and slightly increased output; summer-autumn rice saw declines in both yield and production; and winter rice posted a notable production increase driven by improved yields. Meanwhile, some annual crops (maize, sweet potato, peanut, soybean) experienced area declines due to lower economic returns, as farmers shifted toward vegetables, fruits, fodder crops, and circular-economy models in agriculture.
Livestock trends highlighted both vulnerability and structural upgrading. Buffalo and cattle herds continued a downward trend. Pig farming performed well in the first half but faced a sharp shock as African swine fever spread from Q3, reducing total pig numbers. However, larger enterprises and farms maintained relatively stable output and expanded investment, offsetting part of the decline—evidence that Vietnam’s livestock sector is consolidating toward larger-scale, biosecurity-oriented production. Poultry remained broadly stable.
Forestry improved: newly planted forest area in 2025 reached 323.3 thousand hectares, up 6.4%, while damaged forest area declined 30.7% to 1,127.6 hectares. Fisheries grew 3.0% overall to 9,947.5 thousand tons, driven by aquaculture growth of 5.1%, while capture fisheries slightly declined—reinforcing the sector’s longer-term shift toward farmed production and higher-value processing.
Industrial acceleration and signals from production, inventories, and jobs
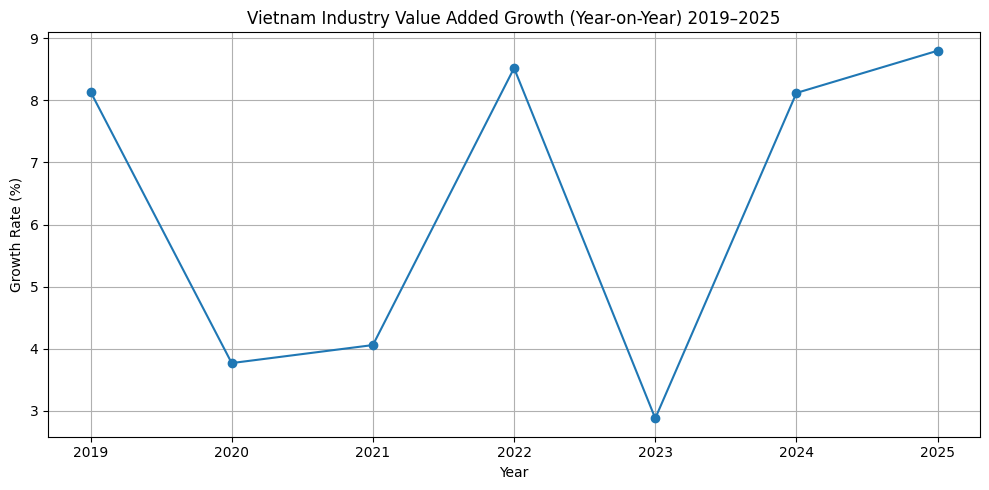
Industrial activity in 2025 strengthened, recording the highest industrial value-added growth since 2019. Value added for industry rose 8.80%, with manufacturing up 9.97%, the strongest in 2019–2025 and the single largest contributor to national growth (31.49% contribution to total value-added growth). Construction also expanded strongly (9.62%), underscoring investment momentum and infrastructure development.
The Index of Industrial Production (IIP) rose 9.2% in 2025 (up from 8.2% in 2024). Manufacturing IIP increased 10.5%, contributing the majority of the overall industrial expansion. Electricity generation and distribution grew 6.7%, while mining remained marginally positive.
Manufacturing shipment and inventory indicators added nuance. The manufacturing shipment index grew 9.9% in 2025, slightly slower than 2024’s 11.4%, suggesting strong but normalizing demand. Inventories increased: as of December 31, manufacturing inventories were up 13.1% year-on-year, and the average Inventory Turnover Ratio rose to 81.1% (from 77.1% in 2024). Rising inventories alongside strong production can reflect both expansion in capacity and the need to monitor demand cycles—especially in export-oriented sectors exposed to global fluctuations.
Employment in industrial enterprises increased 2.4% year-on-year as of December 1, while also rising month-on-month, signaling continued labor absorption—important for incomes, consumption, and social stability.
Services, tourism, transport, and consumer demand strengthen
Services were a major growth pillar in 2025, supported by trade, transport, finance, and an exceptionally strong tourism recovery. Service value added rose 8.62%, with several market services expanding at double-digit rates: transportation and storage grew 10.99%, accommodation and food services increased 10.02%, and wholesale and retail trade rose 8.52%. Financial, banking, and insurance grew 7.82%, reflecting deepening financial intermediation as investment and credit expanded.
Retail and consumer services were robust. Total retail sales of consumer goods and services reached VND 7,008.9 trillion, up 9.2% nominally; excluding price effects, real growth was about 6.7%, matching 2024’s pace and implying steady purchasing power gains.
Transport volumes surged: passenger trips increased 22.2% for the year, and freight carried rose 14.1%, reflecting both domestic mobility and trade-linked logistics. Telecommunications revenue reached VND 380.0 trillion, up 6.0%, a steady expansion consistent with digital consumption and enterprise connectivity.
Tourism stood out: international arrivals reached nearly 21.2 million, up 20.4%, the highest level on record, while outbound Vietnamese trips reached 6.7 million, up 26.4%—a signal of rising incomes and stronger regional mobility.
Trade, investment, finance: A strong momentum, structural dependence remains
Trade volumes were exceptional. Goods exports reached USD 475.04 billion (+17.0%), while imports reached USD 455.01 billion (+19.4%). Vietnam posted a goods trade surplus of USD 20.03 billion, though smaller than 2024’s surplus. A key structural insight remained unchanged: the FDI sector dominated exports (77.3%), while the domestic sector accounted for 22.7% and recorded a trade deficit, whereas the FDI sector posted a large surplus. Manufactured goods comprised 88.7% of exports, reinforcing Vietnam’s position as a global manufacturing hub.
The United States remained the largest export market (USD 153.2 billion), and China remained the largest import market (USD 186.0 billion). Services trade also expanded, with services exports at USD 30.31 billion (+18.9%), led by tourism and transport, while services imports were USD 40.54 billion, producing a services deficit of USD 10.23 billion.
Investment activity strengthened. Total realized investment reached VND 4,150.5 trillion, up 12.1%. Total inward foreign investment reached USD 38.42 billion (+0.5%), while realized FDI was estimated at USD 27.62 billion (+9.0%). Outward investment accelerated sharply, with newly licensed and adjusted capital totaling USD 1.362 billion, up 88.7%—suggesting that a subset of Vietnamese firms is gaining scale and beginning to internationalize.
Monetary and financial indicators reflected expansion. Money supply rose 14.98%, capital mobilization increased 13.68%, and credit growth reached 17.65%, supporting investment and working capital needs. The stock market’s average trading value rose 39.1%, while bond and derivatives markets also expanded, indicating improving liquidity and risk appetite. Inflation remained within the national target: average CPI increased 3.31%. Notably, gold prices surged (average gold CPI up 47.67%), while the US dollar price index rose about 3.92% on average—signals of global uncertainty and hedging behavior.
Social outcomes, risks, and the policy agenda
Vietnam’s population reached an estimated 102.3 million, up 0.99%. The labor force grew, employment rose, and incomes improved: average monthly income in 2025 was VND 8.4 million, up 8.9% year-on-year. The unemployment rate at working age was 2.22%, slightly lower than 2024. Household living standards improved, with average per capita income around VND 5.9 million per month (+9.3%) and the multidimensional poverty rate falling to about 1.3%.
At the same time, risks remained tangible. Natural disasters caused significant losses, with total damage estimated at VND 102,665.3 billion and 489 deaths/missing persons. Public health pressures included dengue fever, hand-foot-mouth disease, and suspected measles outbreaks. Traffic accidents declined substantially, reflecting progress in safety outcomes, while environmental violations and fire incidents remained areas requiring stronger enforcement and prevention.
Overall, 2025 positioned Vietnam as a rapidly scaling economy with strong production capacity, expanding services, improving productivity, and a historic tourism rebound. The key strategic challenge remains to convert high growth into deeper domestic value creation—reducing over-reliance on the FDI export surplus, strengthening domestic firms’ competitiveness, raising technology and innovation adoption, and building resilience to climate, health, and global demand shocks.

