Published Jan 2025
Vietnam's Garment Exports in 2024: A Year of Growth and Opportunity
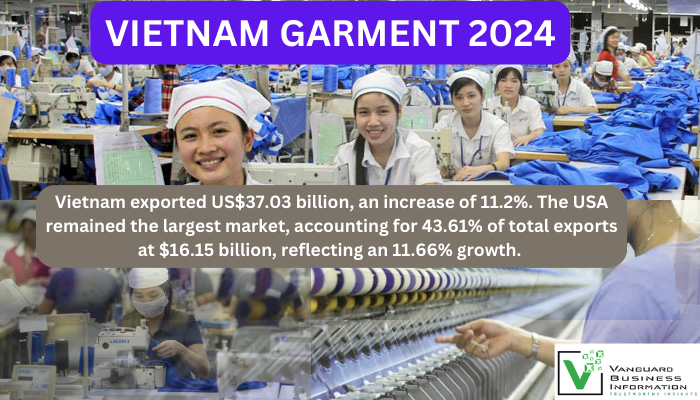
Vietnam exported $37.03 billion worth of textiles and garments in 2024, an increase of 11.2% year over year. The United States remained the largest market, accounting for 43.61% of total exports at $16.15 billion, reflecting an 11.66% growth. Other major markets include the CPTPP bloc ($6.76 billion), Japan ($4.33 billion), and Canada ($1.21 billion), all of which are showing steady growth.

Vietnam's Garment Exports in 2024: A Year of Growth and Opportunity
Vietnam’s garment and textile industry showcased impressive growth and resilience in 2024, securing its position as a global export leader. With total exports reaching $44.4 billion, an increase of 10.3% compared to 2023, the country ranked second among the world’s largest textile and garment exporters, just behind China.
Export Performance and Key Markets
Vietnam exported $37.03 billion worth of textiles and garments in 2024, an increase of 11.2% year over year. The United States remained the largest market, accounting for 43.61% of total exports at $16.15 billion, reflecting an 11.66% growth. Other major markets include the CPTPP bloc ($6.76 billion), Japan ($4.33 billion), and Canada ($1.21 billion), all of which are showing steady growth.
Among CPTPP markets, Mexico and Australia stood out with growth rates of 28.63% and 20.97%, respectively, driven by trade agreements and growing demand. However, some markets such as Singapore (-4.63%) and Chile (-21.84%) saw declines due to market-specific challenges.
Factors Driving Growth
- Economic Recovery in Key Markets: Post-pandemic economic recovery in major markets like the U.S. and EU boosted consumer demand for apparel, providing a favorable environment for Vietnam’s exporters.
- Supply Chain Shifts: Vietnam benefited from a shift in global supply chains, as companies looked to diversify away from China and Bangladesh. Notably, orders previously destined for Bangladesh moved to Vietnam, contributing to increased exports.
- Free Trade Agreements: Agreements like the EVFTA (EU-Vietnam Free Trade Agreement) and RCEP (Regional Comprehensive Economic Partnership) enhanced Vietnam’s competitiveness by reducing tariffs and improving access to global markets.
- Innovation and Compliance: Vietnamese manufacturers increasingly prioritize compliance with stringent rules of origin and supply chain traceability, which allows them to capitalize on tariff advantages and secure larger orders.
Top Performing Companies
Leading exporters in 2024 included Gain Lucky (Vietnam) Co., Ltd., which achieved the highest export turnover of $800.47 million, a growth of 15.57%. Other top performers included Tinh Loi Garment Co., Ltd. (+35.42%) and Tex-Giang JSC, which saw an impressive 65.65% growth—companies with strong growth invested in modernizing production processes and improving efficiency.
Challenges Faced
Despite the positive growth, the industry faced several challenges:
- Material Shortages: Limited domestic supply of raw materials hindered companies from fully leveraging trade agreements.
- Global Competition: Countries like India benefited from similar supply chain shifts, creating stiff competition.
- Economic and Policy Uncertainties: Potential changes in U.S. trade policies, including a 10-20% tariff on certain countries and a 60% tariff on Chinese goods, created concerns for exporters.
Outlook for 2025
VNBIS experts project Vietnam’s garment exports to reach $45.5-$46 billion in 2025. The outlook remains optimistic due to anticipated economic recovery in key markets and the implementation of institutional reforms to reduce business costs. Additionally, Vietnam's ability to comply with global standards for origin and traceability will further enhance its competitive edge.
However, challenges persist, including potential tariff changes and reduced orders from markets like Bangladesh as they stabilize. Addressing supply chain bottlenecks and leveraging free trade agreements will be crucial for sustained growth.
Conclusion
Vietnam's garment industry in 2024 solidified its global position and showcased its ability to adapt to changing market dynamics. With continued efforts to modernize, comply with global standards, and explore new markets, the industry is well-positioned to achieve more significant milestones in the years to come.
APPENDIX
Table 1: Exported Markets for Vietnam's Textile and Garment in 2024
|
Market |
2024 (US$K) |
YoY Change (%) |
Share (%) 2024 |
Share (%) 2023 |
Dec 2024 (US$K) |
YoY Change (Dec %) 2023 |
|
Total |
37,036,852 |
11.15 |
100.00 |
100.00 |
3,373,148 |
16.24 |
|
USA |
16,151,794 |
11.66 |
43.61 |
43.41 |
1,537,116 |
18.05 |
|
CPTPP |
6,760,366 |
8.52 |
18.25 |
18.70 |
617,700 |
13.00 |
|
- Japan |
4,329,172 |
6.76 |
11.69 |
12.17 |
391,718 |
13.49 |
|
- Canada |
1,210,777 |
10.43 |
3.27 |
3.29 |
106,416 |
11.22 |
|
- Australia |
570,271 |
20.97 |
1.54 |
1.41 |
55,785 |
16.23 |
|
- Mexico |
217,563 |
28.63 |
0.59 |
0.51 |
20,465 |
42.05 |
|
EU |
4,241,931 |
12.70 |
11.45 |
11.30 |
387,657 |
25.94 |
|
- Netherlands |
1,223,956 |
25.33 |
3.30 |
2.93 |
109,234 |
13.48 |
|
- Germany |
795,236 |
-5.25 |
2.15 |
2.52 |
81,268 |
20.98 |
|
- Spain |
607,738 |
11.97 |
1.64 |
1.63 |
55,693 |
28.71 |
|
- France |
499,315 |
20.81 |
1.35 |
1.24 |
40,299 |
39.01 |
|
- Belgium |
410,951 |
4.04 |
1.11 |
1.19 |
33,334 |
40.84 |
|
South Korea |
3,148,628 |
3.52 |
8.50 |
9.13 |
228,588 |
0.68 |
|
China |
1,326,742 |
18.52 |
3.58 |
3.36 |
117,486 |
7.36 |
|
Cambodia |
888,166 |
10.15 |
2.40 |
2.42 |
80,582 |
23.10 |
|
UK |
765,340 |
14.49 |
2.07 |
2.01 |
73,133 |
38.31 |
|
Russia |
762,470 |
55.58 |
2.06 |
1.47 |
50,212 |
-19.10 |
|
Indonesia |
452,043 |
24.08 |
1.22 |
1.09 |
37,652 |
39.60 |
|
Thailand |
288,972 |
23.77 |
0.78 |
0.70 |
28,013 |
29.67 |
|
Taiwan |
277,061 |
1.72 |
0.75 |
0.82 |
24,671 |
-13.07 |
|
Bangladesh |
194,874 |
25.15 |
0.53 |
0.47 |
24,047 |
79.51 |
|
India |
179,361 |
2.97 |
0.48 |
0.52 |
17,006 |
15.54 |
|
UAE |
158,455 |
36.62 |
0.43 |
0.35 |
13,374 |
42.94 |
|
Philippines |
138,232 |
9.82 |
0.37 |
0.38 |
14,991 |
38.98 |
|
Brazil |
70,492 |
5.89 |
0.19 |
0.20 |
7,415 |
30.28 |
|
Turkey |
51,615 |
7.97 |
0.14 |
0.14 |
3,692 |
14.66 |
|
Sri Lanka |
47,443 |
-0.09 |
0.13 |
0.14 |
3,637 |
-13.78 |
|
Saudi Arabia |
43,258 |
-24.82 |
0.12 |
0.17 |
2,932 |
-39.67 |
Table 2. : Top 20 Textile and Garment Exporters in Vietnam (2024)
|
Rank |
Company Name |
2024 (USD '000) |
2023 (USD '000) |
Growth (%) |
|
1 |
800,474 |
692,625 |
15.57 |
|
|
2 |
756,234 |
558,454 |
35.42 |
|
|
3 |
610,036 |
592,550 |
2.95 |
|
|
4 |
575,950 |
538,113 |
7.03 |
|
|
5 |
540,475 |
465,395 |
16.13 |
|
|
6 |
441,430 |
266,486 |
65.65 |
|
|
7 |
381,873 |
363,494 |
5.06 |
|
|
8 |
345,492 |
344,808 |
0.20 |
|
|
9 |
306,075 |
287,689 |
6.39 |
|
|
10 |
295,691 |
239,705 |
23.36 |
|
|
11 |
283,965 |
247,723 |
14.63 |
|
|
12 |
277,711 |
275,830 |
0.68 |
|
|
13 |
272,173 |
230,945 |
17.85 |
|
|
14 |
262,383 |
186,053 |
41.03 |
|
|
15 |
257,579 |
188,662 |
36.53 |
|
|
16 |
229,728 |
235,240 |
-2.34 |
|
|
17 |
229,363 |
213,678 |
7.34 |
|
|
18 |
225,618 |
185,286 |
21.77 |
|
|
19 |
220,660 |
215,276 |
2.50 |
|
|
20 |
216,814 |
218,463 |
-0.75 |
Compiled by Ami Le
Vanguard Business Information LLC
Reference: WTO, GSO, VietnamCustoms


