Published Mar 2026
RM169 Billion and Counting: Malaysia's Manufacturing Machine Accelerates, But Not Everyone Is Winning
Malaysia's manufacturing sector hit RM169.4 billion in January 2026, growing 7.1% year-on-year. But beneath the record numbers lies a sector running on two speeds: electronics booming, petrochemicals contracting. Here is what the data really signals for businesses across ASEAN.

MALAYSIA MANUFACTURING STATISTICS: KEY PERFORMANCE INDICATORS — JANUARY 2026
|
RM169.4B Total Sales Value |
+7.1% YoY Growth Rate |
2.4M Paid Employees |
RM8.71B Salaries & Wages |
RM69,779 Sales per Employee |
Malaysia's manufacturing sector opened 2026 on a confident note. The Department of Statistics Malaysia (DOSM) reported total sales of RM169.4 billion in January 2026, a 7.1% year-on-year increase (compared to 6.4% in December 2025), with seasonally adjusted figures indicating a 2.9% month-on-month increase. At first glance, the headline numbers tell a story of broad-based industrial momentum. Look deeper, however, and a more nuanced, risk-layered picture emerges, one that demands close attention from business leaders, investors, and anyone navigating the ASEAN business landscape.
This analysis, drawing on the latest DOSM Monthly Manufacturing Statistics and the financial data and industry insights available through VNBIS.COM, unpacks both the opportunities and the warning signs embedded in Malaysia's January 2026 manufacturing performance.
1. The Headline Numbers: A Sector in Full Stride
Year-on-year growth has been accelerating. From a modest 3.5% in January 2025, the manufacturing sector's sales growth climbed steadily to reach 7.1% twelve months later, with the second half of 2025 acting as the key inflection point. October 2025 saw 6.3% YoY growth, November held at 4.6%, and December surged to 6.4% before January 2026 pushed past 7%.
Seasonally adjusted sales also rose 2.9% month-on-month in January 2026, a meaningful gain given that January typically carries post-holiday slowdowns. This suggests that underlying industrial demand is structurally stronger than seasonal patterns alone would explain.
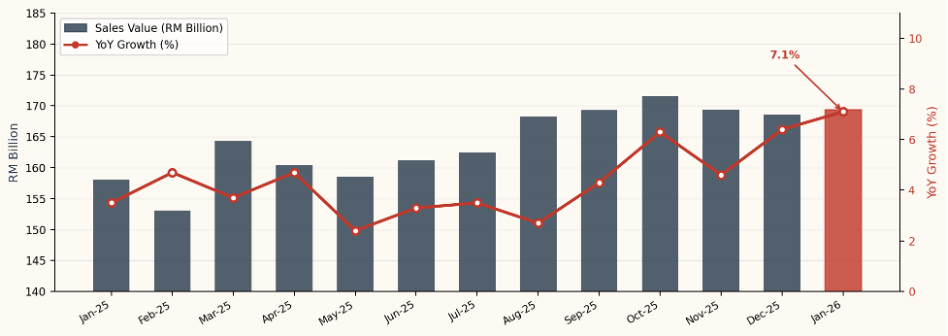
Chart 1: Manufacturing Sales Value and YoY Growth Rate, Jan 2025 – Jan 2026
2. Electronics Leads, But Concentration Risk Looms
The single biggest contributor to January's sales expansion is the Electrical and Electronics (E&E) Products sub-sector, which grew a striking 15.6% year-on-year (accelerating from 12.6% in December 2025). E&E accounts for roughly 33.9% of total manufacturing sales, making it far and away the dominant pillar of the sector.
The Food, Beverages, and Tobacco sub-sector contributed another layer of support, rising 12.4% YoY (from 10.4% in December 2025), while Non-metallic Mineral Products, Basic Metal, and Fabricated Metal grew 5.7% YoY. These three sub-sectors together underpin the majority of headline growth.
See Chart 2: Sub-sector Share of Manufacturing Sales Value
Sub-Sector Performance Summary, January 2026
|
Sub-Sector |
YoY% Jan-26 |
YoY% Dec-25 |
MoM% Jan-26 |
Share % |
|
Electrical & Electronics |
+15.6% |
+12.6% |
+4.0% |
33.9% |
|
Food, Beverages & Tobacco |
+12.4% |
+10.4% |
+0.3% |
20.4% |
|
Petroleum, Chemical, Rubber & Plastic |
-5.5% |
-2.7% |
-2.0% |
21.5% |
|
Non-metallic Mineral, Basic & Fabricated Metal |
+5.7% |
+5.3% |
— |
24.2% |
Risk Flag: When a single sub-sector (E&E at 33.9% share) drives a disproportionate share of headline growth, the sector's apparent resilience can mask underlying fragility. Any demand shock in global semiconductor or electronics supply chains — whether from trade tensions, tariff escalations, or a softening in consumer electronics demand — would transmit rapidly into Malaysia's manufacturing aggregate.
3. A Critical Red Flag: Petroleum and Chemicals Are Contracting
While E&E grabs the spotlight, a critical counter-trend deserves sharper scrutiny. The Petroleum, Chemical, Rubber, and Plastic sub-sector, the second-largest contributor at 21.5% of total manufacturing sales, contracted by 5.5% year-on-year in January 2026. This is a deterioration from the 2.7% decline recorded in December 2025, and month-on-month, this sub-sector fell a further 2.0%.
For a country where petrochemical industries form a foundational layer of industrial output and export earnings, a sustained decline in this sub-sector is not simply a statistical footnote. It reflects broader pressures: subdued global oil and gas prices, shifting refinery economics, reduced downstream chemical demand from key trading partners, and the ongoing restructuring of global plastics supply chains driven by environmental regulation.
Business Intelligence Perspective (via VNBIS.COM): Companies seeking company credit reports or financial data on Malaysian petrochemical firms should treat this contraction as a sector-wide credit risk indicator. Firms with high exposure to downstream chemical or rubber manufacturing may face tightening margins in the months ahead.
4. Labour Market Strength, With a Wage Gap Worth Watching
The manufacturing workforce grew to 2.427 million employees in January 2026, a 1.3% year-on-year increase (up from 1.1% in December 2025). Month-on-month, headcount edged up 0.1%. The growth was led by Food, Beverages, and Tobacco (2.0% YoY), E&E (1.8% YoY), and Non-metallic Mineral and Metal Products (1.3% YoY).
Total salaries and wages paid reached RM8.71 billion in January 2026, growing 2.8% YoY. However, average salaries per employee came in at RM3,590 per month, rising just 1.4% year-on-year and notably lower than the RM3,756 recorded in December 2025 (a month-on-month decline of 4.4%), reflecting the seasonal drag of January post-bonus cycles. While retail trade performance in 2025 reveals a market that remains fundamentally strong, yet quietly adjusting beneath the surface.
The divergence between headline wage bill growth (2.8% YoY) and per-worker wage growth (1.4% YoY) signals that the sector is expanding employment faster than it is raising individual compensation. For a risk management lens, this suggests a labour cost structure that may face upward wage pressure as Malaysia's minimum wage policies and regional talent competition intensify across ASEAN.
5. Productivity Is Rising, But Unevenly
One genuinely encouraging signal in the data is the improvement in sales value per employee, which rose 5.7% year-on-year to RM69,779 in January 2026 (from RM66,011 in January 2025). On a month-on-month basis, it was also up 0.4%.
Rising productivity per worker is a healthy sign of capital-to-labour deepening, likely driven by technology investments in the E&E and food processing segments. However, productivity gains concentrated in export-oriented high-tech industries do not automatically translate into broad-based economic uplift. Domestic-oriented manufacturers, particularly in textiles, wood products, and rubber-based industries, may be lagging significantly behind in the productivity curve.
Chart 3: Employees (Millions) and Salaries & Wages (RM Billion), Jan 2025 – Jan 2026
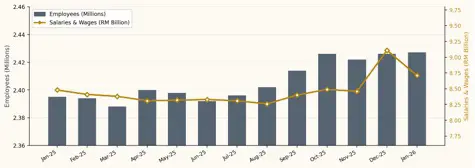
Source: DOSM Monthly Manufacturing Statistics, January 2026
6. Export Versus Domestic: A Two-Speed Economy in Manufacturing
The data makes a structurally important distinction between export-oriented industries (contributing 70.2% of total sales) and domestic-oriented industries (29.8%). In January 2026, export-oriented industries grew 12.4% YoY (compared with 10.4% in December 2025), with strong momentum continuing into the new year. Domestic-oriented industries, however, contracted 5.5% YoY (against a 2.7% decline in December 2025), and fell a further 2.0% month-on-month.
This divergence is the most consequential structural tension in the January 2026 data. Malaysia's manufacturing growth story is, at its core, an export-technology story, tightly coupled to global semiconductor demand cycles, US and European tech capex trends, and East Asian electronics supply chains. The domestic manufacturing base is not only not keeping up; it is actively shrinking in sales terms.
7. What This Means for Business Decisions in ASEAN
For businesses operating across the ASEAN region, January 2026's Malaysian manufacturing data carries several practical implications. Companies sourcing components from Malaysian manufacturers, especially in the E&E segment, face a supplier landscape where capacity is growing, but concentration risk is high. Supply chain due diligence should incorporate not just financial performance data, but also sub-sector vulnerability assessments.
Investors and credit analysts evaluating Malaysian manufacturing firms should apply differentiated risk lenses across sub-sectors. E&E and food-processing firms present a broadly positive growth backdrop, while petroleum, chemical, and rubber-based manufacturers are navigating headwinds that may erode creditworthiness over 2026. Accessing up-to-date company credit reportsand verified financial data through platforms such as VNBIS.COM is essential to separate strong performers from distressed operators within the same headline statistics.
DOSM's data also notes that January 2026 figures remain provisional and subject to revision in the February 2026 release. Businesses making significant procurement, credit, or investment decisions should treat the current figures as directional indicators rather than definitive benchmarks, and revisit their assessments as updated data becomes available.
For a comprehensive view of Malaysian and broader ASEAN manufacturing business landscapes, including sectoral financial data, corporate credit intelligence, and industry insights tailored for risk-aware decision-making, visit vnbis website, your trusted ASEAN Business Gateway.
Access Deeper Business Information on ASEAN MarketsGet Company Credit Reports, Financial Data, and Industry Insights across Malaysia www.VNBIS.COM — Your ASEAN Business Gateway |
Prepared by Allie LE, Vanguard Business Information LLC. Source: Department of Statistics Malaysia (DOSM), Monthly Manufacturing Statistics, January 2026.
 reached its lowest figure in Q3 2023 at 12.05 days.")
