

VIETNAM BUSINESS INFORMATION LLC
Other Reports
"An investment in knowledge pays the best interest." (Benjamin Franklin)
Our team is ready to work with you to find the perfect solution that fits your requirements.
INDUSTRY REPORT

Deloitte - Doing Business in Vietnam 2022 - 2023
INDUSTRY REPORT
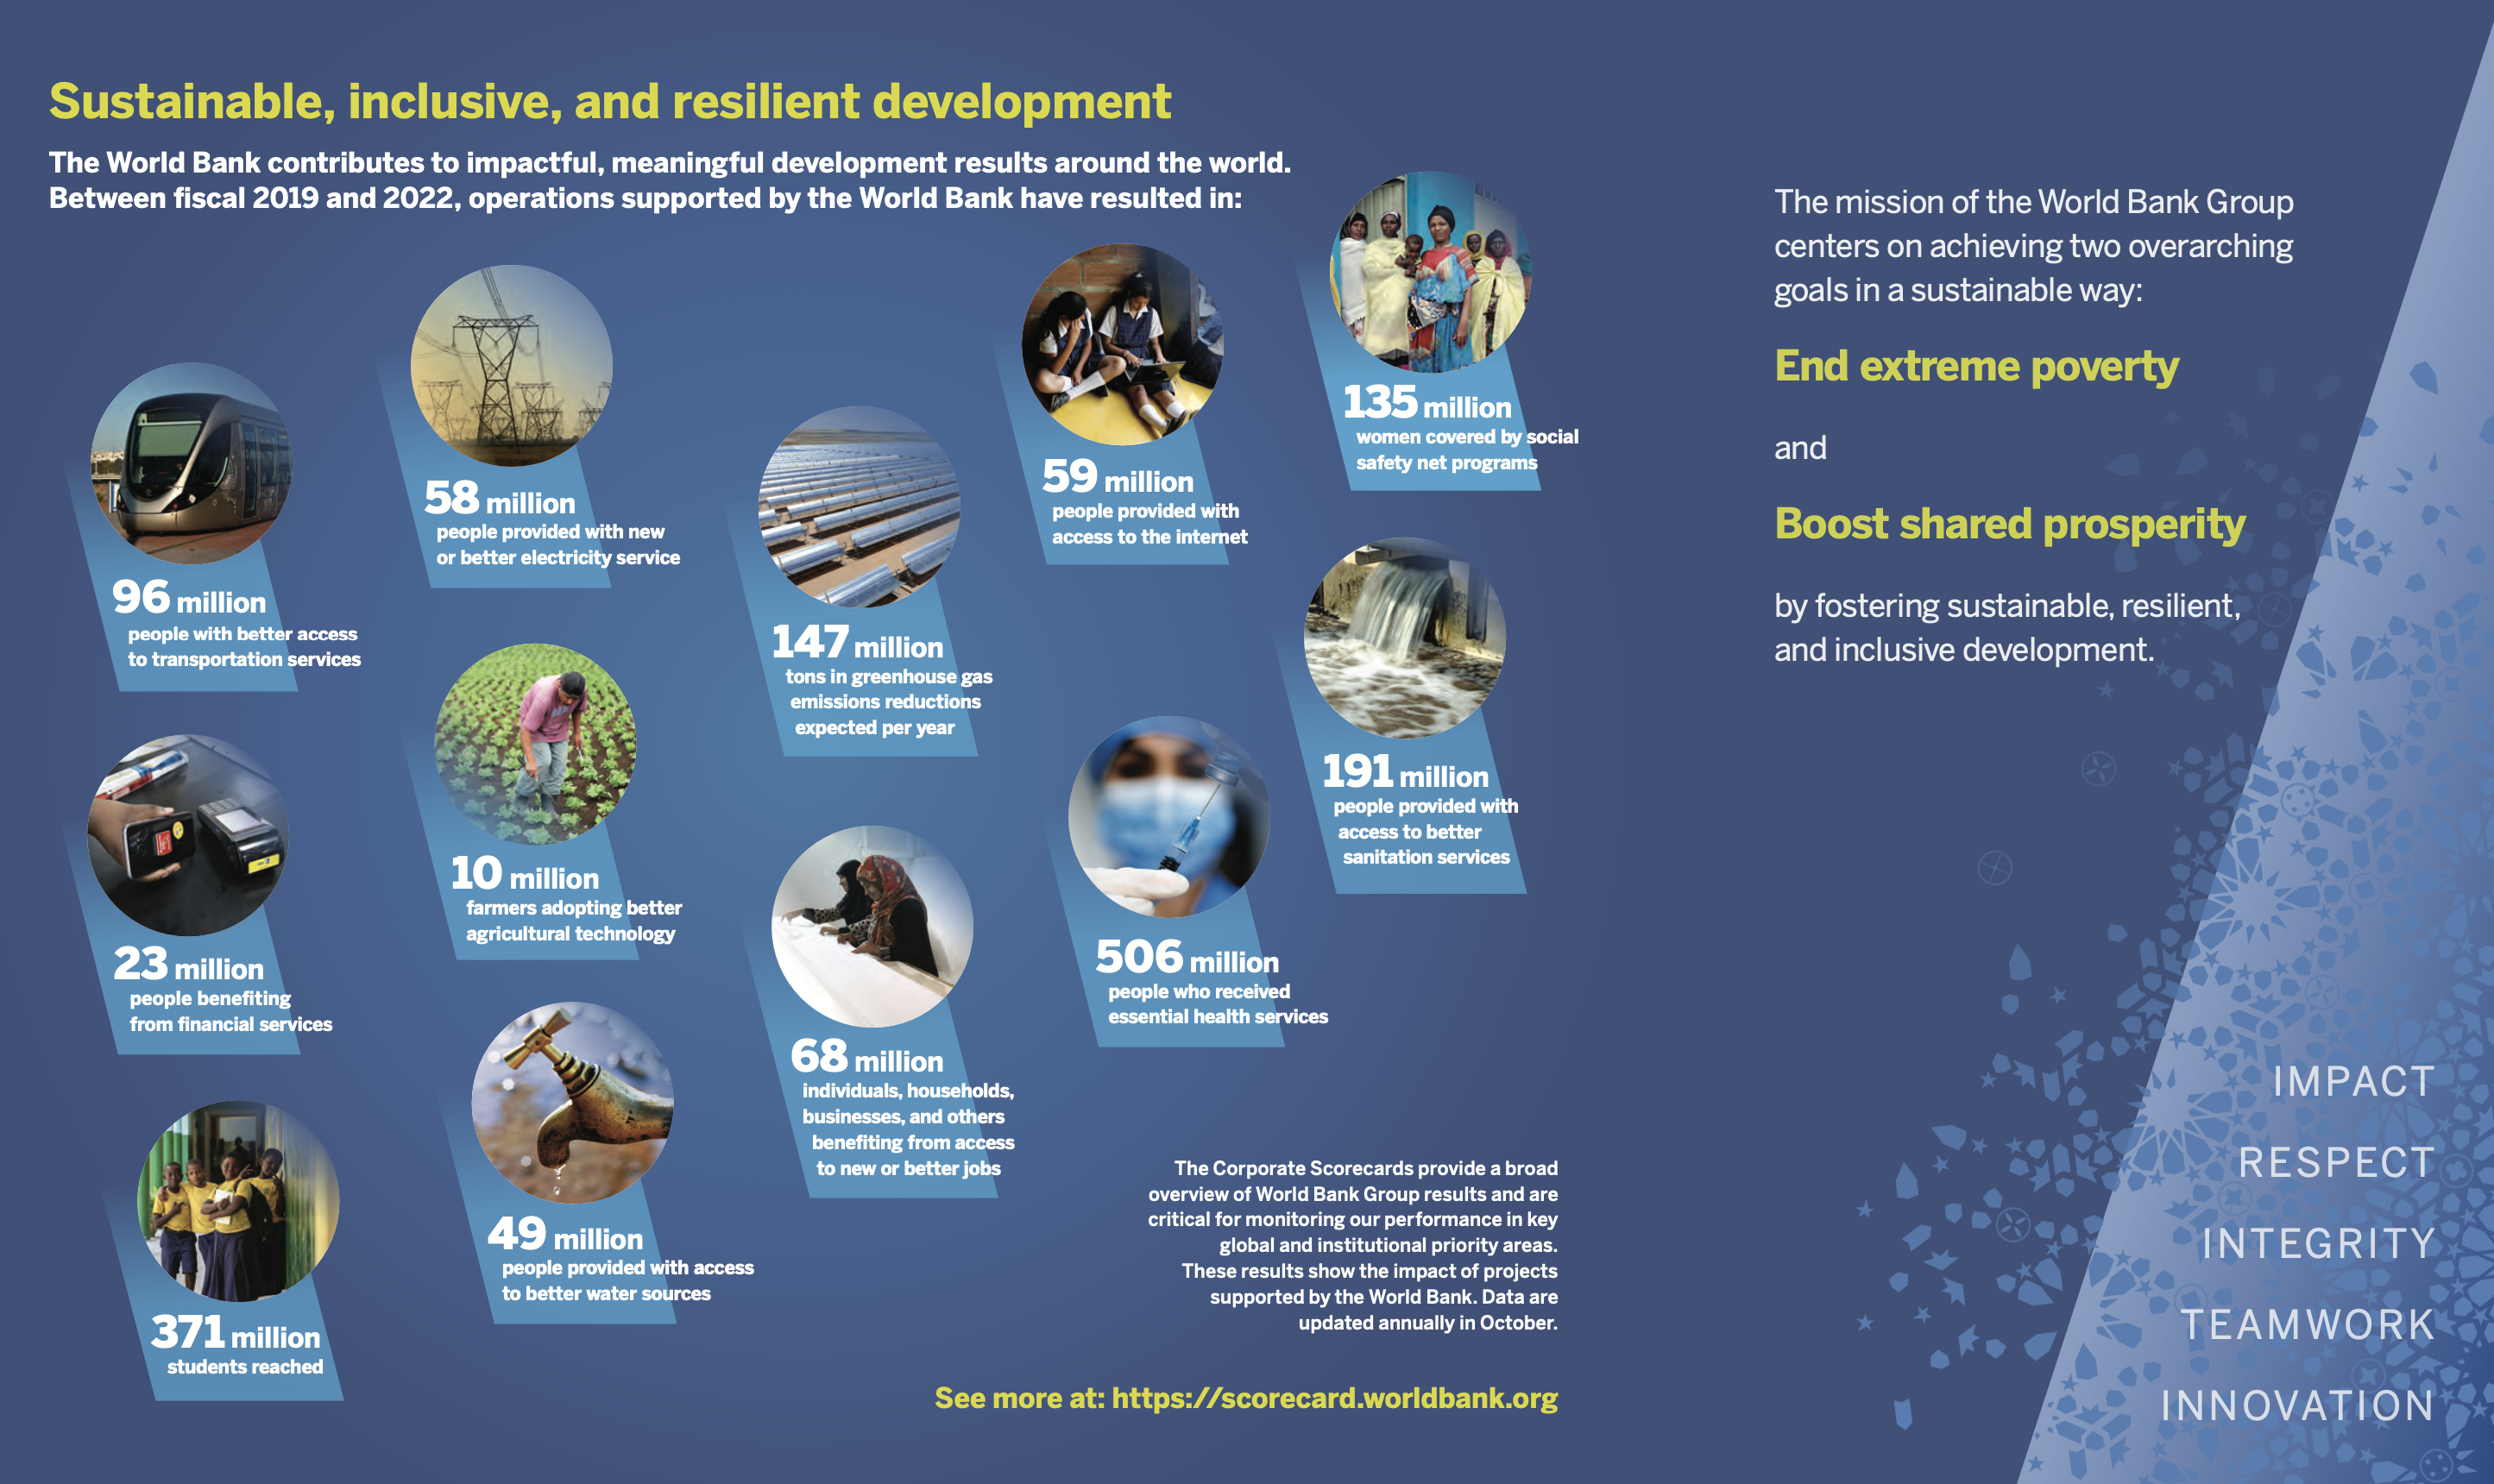
WORLD BANK 2023 ANNUAL REPORT

VIETNAM ELECTRICITY INDUSTRY REPORT 2020
VBI - Vietnam Business Information would like to introduce the Vietnam Electricity Industry Report put together by VietnamCredit in 2020.
For over 65 years, Vietnam's Electricity Industry has been pivotal in driving socio-economic development, yet it faces significant challenges ahead.
Dominance by Vietnam Electricity (EVN) across production, transmission, and distribution characterizes the sector. Despite a commendable 10% annual load growth, challenges like a 6.5% power loss persist. While ranking 23 globally and 2nd in ASEAN, overreliance on hydropower poses instability due to weather dependency and nearing maximum exploitation.
Meeting a soaring annual GDP growth rate of 6.5%-7% demands a matching 11-11.5% annual electricity sector growth. However, current output lags at 10%, signaling an imminent power shortage. Diversifying investment sources and infrastructure development are crucial, with investments nearing $117 billion by 2030.
Resolution No. 55 aims to foster a transparent and competitive market, initially retaining EVN's transmission monopoly. Future endeavors may see private participation in generation, paving the way for a dynamic energy landscape.
In essence, while Vietnam's Electricity Industry stands as a beacon of progress, collaborative efforts and strategic reforms are essential for a resilient and sustainable energy future.
TABLE OF CONTENTS
1. Vietnam’s Economic Situation
1.1. Economic growth
1.2. Trade and prices
1.3. Realized capital, State budget revenue and expenditure
1.4. Import-export activities
1.5. Establishment and dissolution of enterprises
2. Vietnamese Electricity Industry’s Development
2.1. Vietnamese Electricity industry overview
2.2. Enterprises and labour in Vietnam’s Electricity industry
2.3. Key ratios of Vietnam’s Electricity industry
2.4. Electricity industry average financial ratios 2019
2.5. Opportunities, challenges and industry forecasts
3. 10 outstanding companies in Vietnam’s Electricity industry in 2019
LIST OF FIGURES
Figure 1.1.1: Vietnam GDP Growth Rate 2011-2020
Figure 1.2.2: GDP Growth, CPI and Inflation (Last year = 100)
Figure 1.2.1: Total retail sales of consumer goods and services at current prices 2015-2019
Figure 1.2.3: Producer price index by sector compared to the previous quarter
Figure 1.2.4: Commodity terms of trade growth rate 2015-2019 (%)
Figure 1.3.1: Growth rate and structure of social investment capital in the first half of the 2016-2020 period at current prices
Figure 1.4.1: Import-export turnover and trade balance of goods 2011-2019 (US $ billion)
Figure 1.5.1: Enterprise Establishment in H1/2020 (compared to H1/2019)
Figure 2.2.1: Number of enterprises and employees in the power sector
Figure 2.2.2: Number of enterprises and employees in the power generation sector
Figure 2.3.1: Power Generation Output in 2013-2020 (billion kWh)
Figure 2.3.2: Power Sales in 2013-2020 (billion kWh)
Figure 2.3.3: Imported Power from China in 2013-2019 (billion kWh)
Figure 2.3.4: PPI of electricity power generation and distribution (%)
Figure 2.3.5: PPI of electricity power generation and distribution in the first 7 months of 2020 (%)
Figure 2.3.6: Total installed power capacity (MW)
Figure 2.3.7: Installed power capacity in 2018 by investors
Figure 2.3.8: Installed power capacity in 2018 by sources
Figure 2.3.9: Total transmission lines through years (km)
Figure 2.3.10: Total quantity of transmitted power through years (million kWh)
Figure 2.3.11: Power loss rates through years (%)
Figure 2.3.12: Scores and Rankings of Vietnam’s Getting Electricity Index (over 100)
Figure 2.3.13: Growth of average retailing electricity price through years
LIST OF TABLES
Table 1.1.1: GDP growth by sector Q1/2020 at current prices
Table 2.3.1: Adjustments in electricity prices and bills amid Covid-19
Table 2.3.2: Current retailing electricity prices and projected prices according to the Ministry of Industry and Trade’s proposed plans
Table 2.5.1: Total demand of power investment in 2014-2030 (billion USD)
1. SOUTHERN POWER CORPORATION
2. HANOI POWER CORPORATION
3. NATIONAL POWER TRANSMISSION CORPORATION
4. AES MONG DUONG POWER COMPANY LIMITED
5. POWER GENERATION JOINT STOCK CORPORATION 3
6. PETROVIETNAM POWER CORPORATION - JSC
7. HAI PHONG THERMAL POWER JOINT STOCK COMPANY
8. PHU MY 3 BOT POWER COMPANY LTD
9. PHA LAI THERMAL POWER JOINT STOCK COMPANY
10. PETROVIETNAM POWER NHON TRACH 2 JOINT STOCK COMPANY
440 Monticello Ave Ste 1802, Norfolk, VA 23510, USA
