

VIETNAM BUSINESS INFORMATION LLC
Other Reports
"An investment in knowledge pays the best interest." (Benjamin Franklin)
Our team is ready to work with you to find the perfect solution that fits your requirements.
INDUSTRY REPORT

Deloitte - Doing Business in Vietnam 2022 - 2023
INDUSTRY REPORT
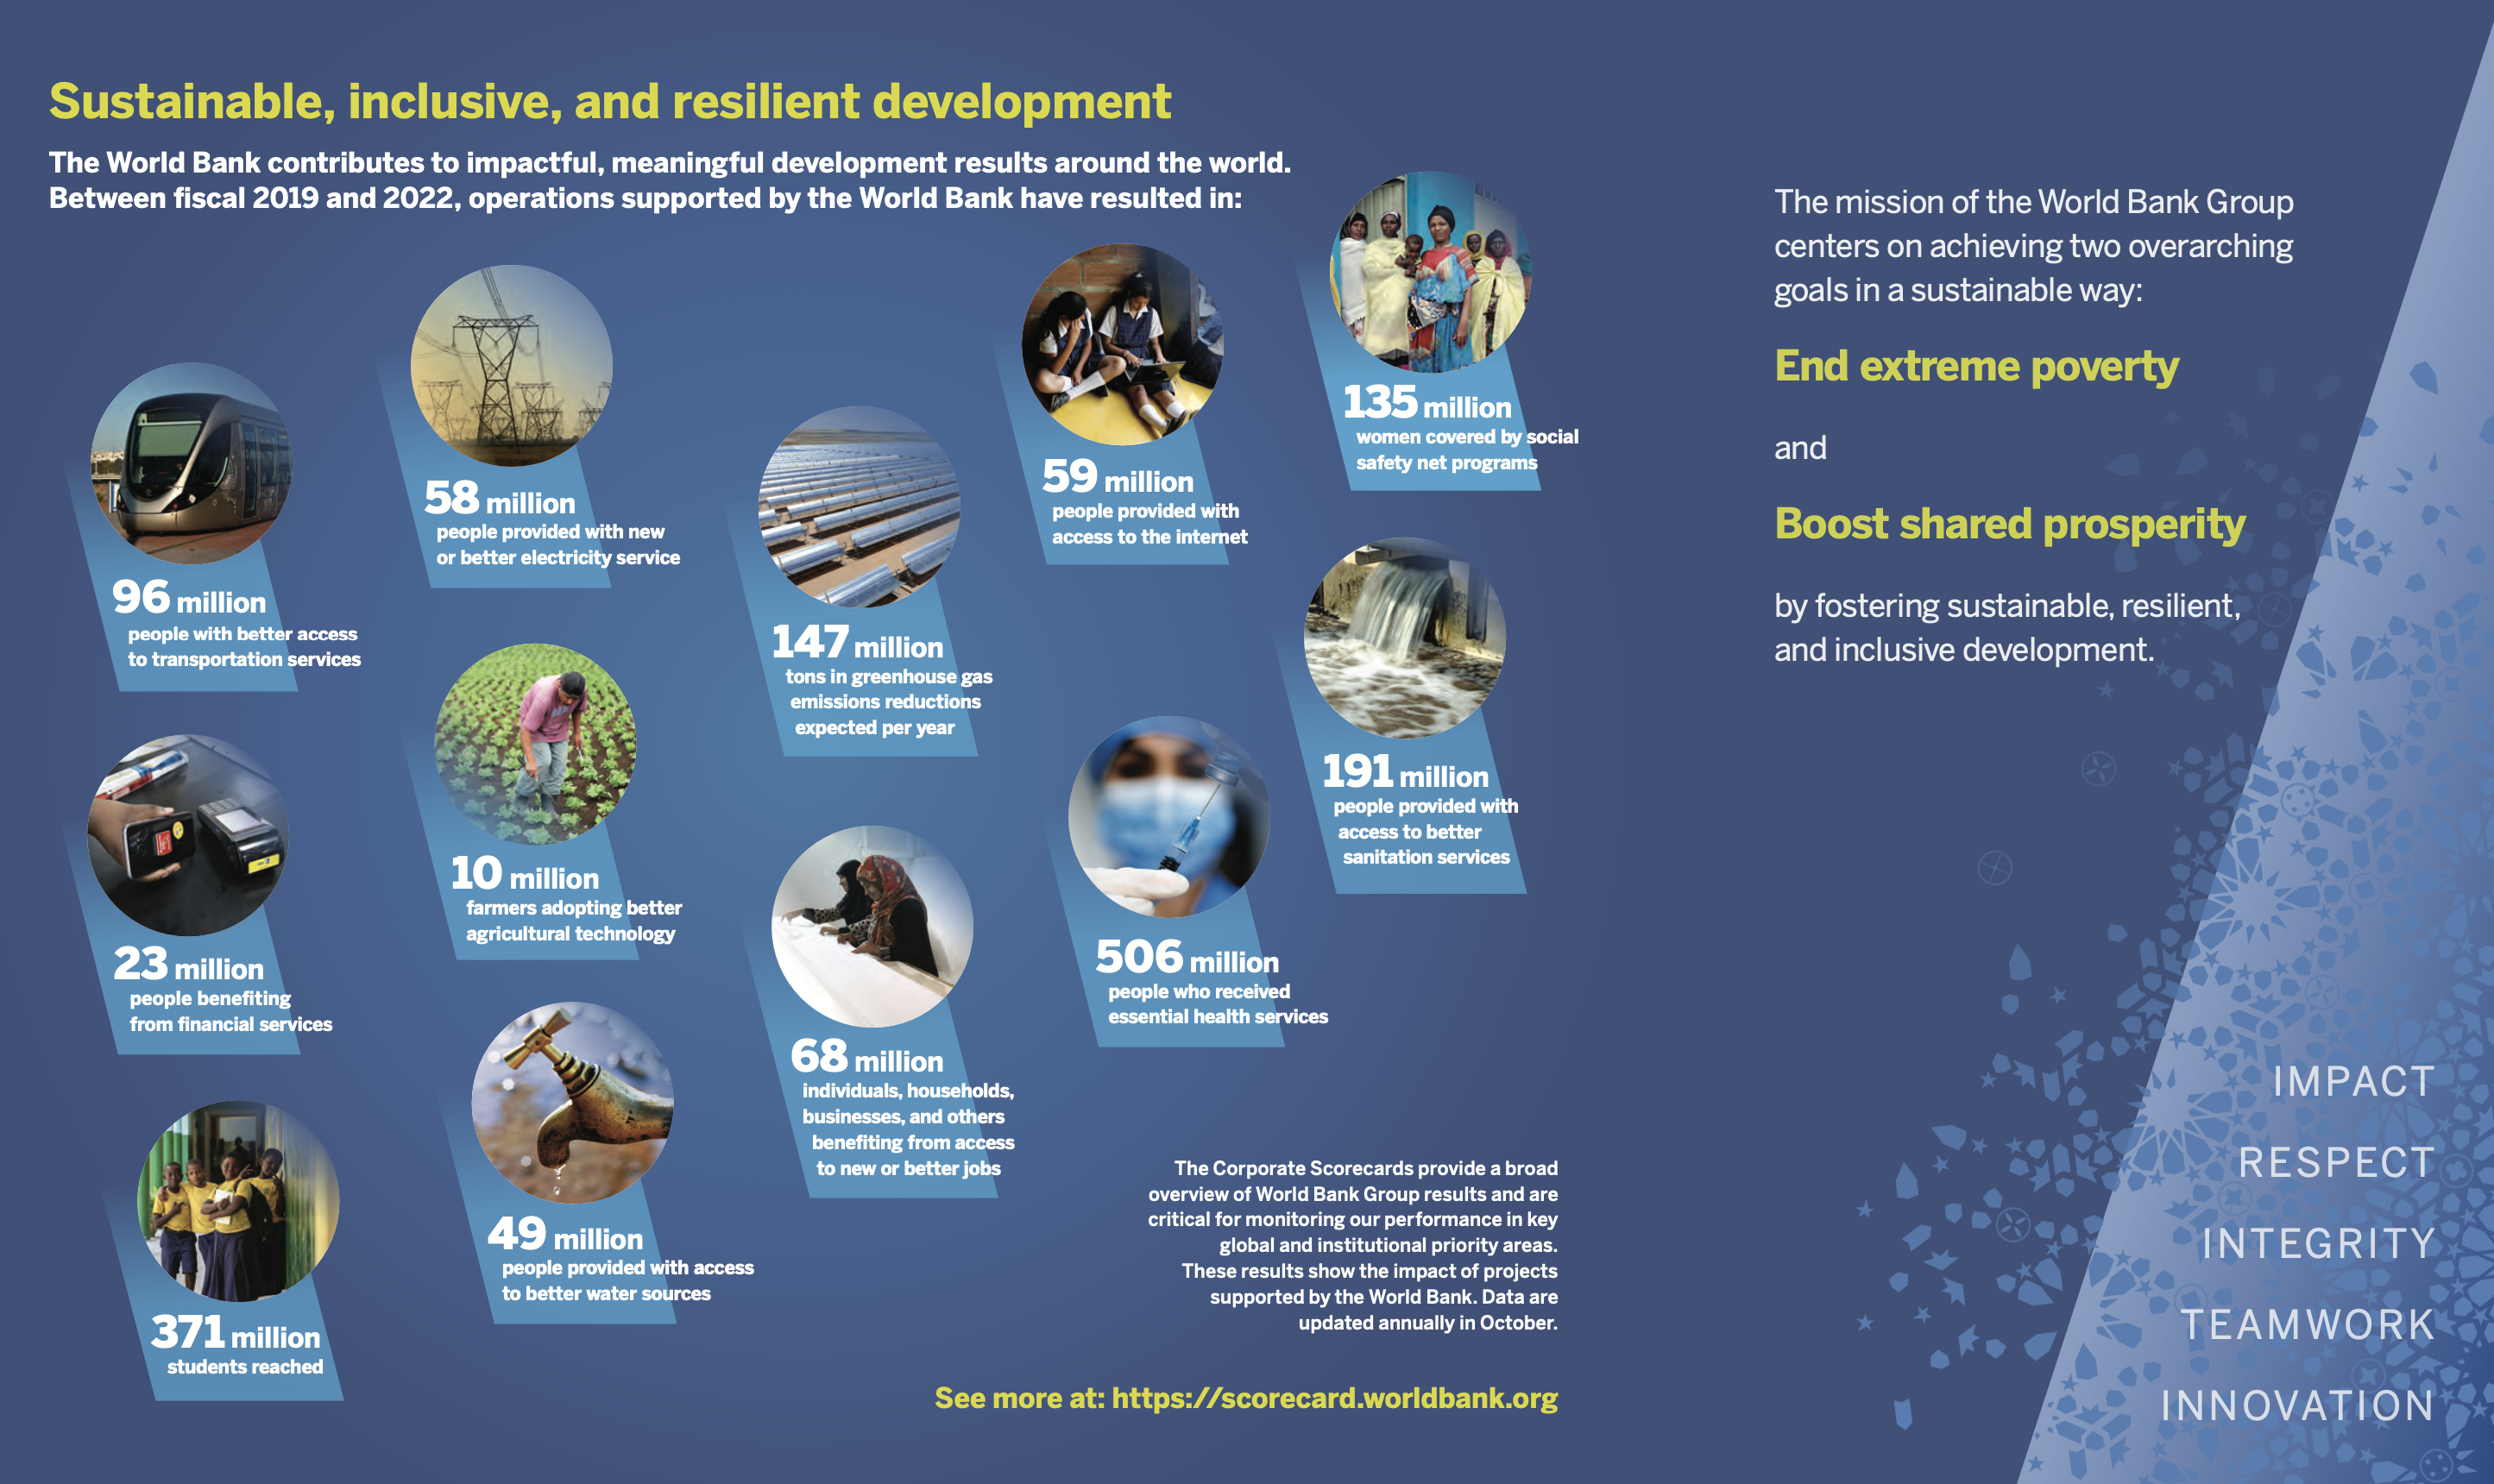
WORLD BANK 2023 ANNUAL REPORT

VIETNAM FRUIT AND VEGETABLE INDUSTRY REPORT 2020
The Fruit & Vegetable Industry Report 2020 put together by VietnamCredit.
Vietnam's Fruit and Vegetable Industry Report 2020 was prepared by VietnamCredit in early September 2020. The report provides readers with general information about Vietnam's macroeconomic situation, and an insight into the fruit and vegetable industry, whilst highlighting various advantages and challenges that the industry is experiencing.
CONTENT
List of charts & figures
List of tables
List of acronyms
1. Macroeconomic situation
1.1. Economic growth
1.2. Trade and prices
1.3. Investment capital and state budget revenue and expenditure
1.4. Import and export
1.5. Establishment and dissolution of enterprises
2. Overview of Vietnam’s fruit & vegetable industry
2.1. Value chain of Vietnam’s fruit & vegetable industry
2.2. Number of enterprises & labor structure
2.3. Market share of Vietnam’s fruit & vegetable industry
2.4. Vietnam’s fruit & vegetable industry average index
3. Vietnam’s fruit & vegetable market
3.1 Production of fruit and vegetables in Vietnam
3.2 Production of major crops
3.3 Production of major fruits
3.4 Consumption of fruit & vegetable in Vietnam
3.5 Import and export turnover of fruit and vegetables
3.6 Main fruit & vegetable export markets
4. Legal environment
5. Industry analysis
6. Top 10 fruit & vegetable companies in Vietnam
LIST OF CHARTS & FIGURES
Chart 1.1.1: Vietnam’s GDP Growth Rate for 2011-2020
Chart 1.2.1: Total retail sales of consumer goods and services at current prices 2015-2019
Chart 1.2.2: GDP Growth, CPI, and Inflation (Last year = 100)
Chart 1.2.3: Producer price index by sector compared to the previous quarter
Chart 1.2.4: Commodity terms of trade growth rate for 2015-2019 (%)
Chart 1.3.1: Growth rate and structure of social investment capital in the first half of 2016-2020 at current prices
Chart 1.4.1: Import-export turnover and trade balance of goods 2011-2019 (billion USD)
Chart 1.5.1: Enterprise establishment in H1/2020 (compared to H1/2019)
Figure 2.1.1: Value chain of Vietnam’s fruit & vegetable industry (by economic sector)
Chart 2.2.1: Components of Vietnam’s fruit & vegetable industry
Chart 2.2.2: Number of companies & employees in the fruit & vegetable industry
Chart 2.3.1: Market share of manufacture of juice sector
Chart 2.3.2: Market share of processing and preserving of fruit & vegetable sector
Chart 2.3.3: Market share of wholesale of fruit and vegetable industry
Chart 2.3.4: Market share of retail sale of fruit and vegetable industry
Chart 3.1.1: Production and cultivation area of vegetables over the years
Chart 3.1.2: Production and cultivation area of fruit over the years
Chart 3.2.1: Cultivation area of major crops (thousand ha)
Chart 3.2.2: Production of major crops (thousand tons)
Chart 3.5.1: Import and export turnover of fruit and vegetables over the years
Chart 3.6.1: Major export markets (for the first 6 months of 2020)
Chart 3.6.2: Major import markets (for the first 5 months of 2020)
LIST OF TABLES
Table 1.1.1: GDP growth by sector for Q2/2020 at current prices
Table 2.4.1: Fruit & vegetable industry average index in 2019
Table 3.3.1: Production and planting acreage of major fruits
Table 6.1: Top 10 fruit & vegetable companies in Vietnam
1. FRUIT AND VEGETABLE EXPORT – IMPORT JOINT STOCK COMPANY
2. CHIPSGOOD - VEGETEXCO JOINT STOCK COMPANY
3. VEGETABLE AND FRUIT EXPORT IMPORT JOINT STOCK COMPANY I
4. BACH KHANG TRADING PRODUCTION IMPORT EXPORT JOINT STOCK COMPANY
5. HOANG SON I JOINT STOCK COMPANY
7. BINH THUAN FRUITS AND GREENS JOINT STOCK COMPANY
8. GIAVICO INTERNATIONAL FOOD COMPANY LIMITED
440 Monticello Ave Ste 1802, Norfolk, VA 23510, USA
