Published Jan 2024
Analysis of changes in Vietnam's GDP structure from 2010-2023
The added value of the processing and manufacturing industry that the Vietnamese economy receives is getting smaller and smaller, which shows that the production situation of this industry group is increasingly focused on processing and assembling in a more comprehensive way.

According to the United Nations System of National Accounts, GDP is calculated using three methods. With the production method, GDP includes the total value added at basic prices of sectors in the economy and product taxes minus subsidies. With the income method, GDP is calculated as the sum of workers' income, producer surplus, fixed asset depreciation and product taxes minus subsidies. Calculating GDP using the final expenditure method includes final consumption (of households and the state), gross accumulation of fixed assets (including depreciation) and the difference between import and export of goods and services.
GDP structure according to the final expenditure method
Regarding the structure of the components of final demand in GDP, data from the General Statistics Office (GSO) shows that the structure of investment (gross accumulation of assets) over a long period of time is about over 30% of GDP; while consumer demand decreased from 68% of GDP in 2010 to 63.4% in 2022, of which the State's final consumption decreases by 1.53 percentage points and the population's final consumption decreases by 3.83 percentage points. The ratio of the difference between import and export of goods and services in GDP was from negative (-5.63%) in 2010 to positive 8% in 2022. However, this contribution is brought by the FDI sector.
Structure of economic components in GDP
Average GDP growth in the period 2010-2023 was about 6%. This is a relatively high growth rate compared to other countries in the region. But looking deeper at the ownership structure in GDP, it can be seen that the contribution to basic GDP by the non-state sector, in which the individual sector during the period 2010-2015 with the highest value-added ratio compared to GDP is always stable at over 31%.
However, on the GSO website, the individual economic sector is not divided into separate economic sectors, but combined into the non-state economic sector (including the enterprise sector, cooperatives and individual business households).
According to GSO data, the current structure of the added value of the non-state economic sector in GDP is not much different from 2010. The added value of the state sector's added value in GDP decreased by about 3 percentage points while that of the foreign investment (FDI) sector increased by about 5 percentage points. Product tax structure (excluding subsidies) decreased by about 2 percentage points.
Industry structure in GDP
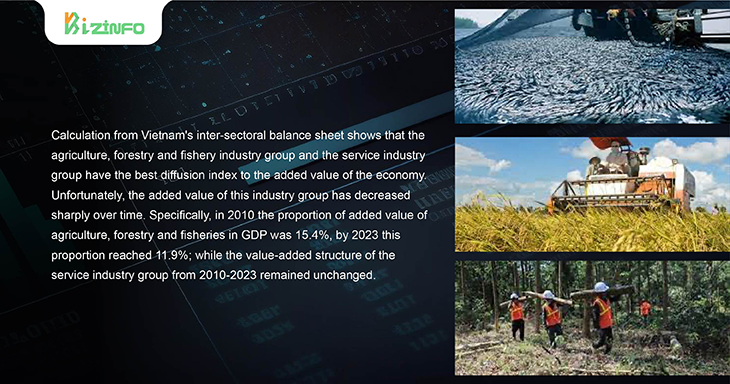
Calculation from Vietnam's inter-sectoral balance sheet shows that the agriculture, forestry and fishery industry group and the service industry group have the best diffusion index to the added value of the economy. Unfortunately, the added value of this industry group has decreased sharply over time. Specifically, in 2010 the proportion of added value of agriculture, forestry and fisheries in GDP was 15.4%, by 2023 this proportion reached 11.9%; while the value-added structure of the service industry group from 2010-2023 remained unchanged.
Also from Vietnam's inter-sectoral balance sheet, the ratio of added value to the overall production value of the economy decreased in the period 2016-2023 compared to the period 2007-2015. In particular, in the processing and manufacturing industry group, this rate decreased from 34.7% in the period 2007-2015 to only 21.7%. Furthermore, this industry group has a low and increasingly low diffusion index and sensitivity to the economy.
This shows that the portion of added value from the processing and manufacturing industry group that the Vietnamese economy receives is getting smaller and smaller. It also shows that the production situation of this industry group is increasingly focused on processing and assembling in a more comprehensive way. Although this rate for the agriculture, forestry and fisheries sector has not decreased as sharply as the industry sector, it also tends to decrease, from 68% in the period 2007-2015 to 63% in the period 2016-2023.
With such an industry structure, it proves that the production efficiency of Vietnam's material manufacturing industries is getting worse and worse. Even though there is a lot of production and a lot of exports, the portion that Vietnam receives is getting less and less.
Thus, the interest in industrialization towards increasing scale may be ineffective. Industrialization should focus on increasing the content of processed industrial products used by other sectors in the economy as inputs in the production process. Industrialization in the direction of broad development, instead of going deeper, can only cause land to be used ineffectively, resources to be lost and the environment to be damaged. Furthermore, the deeper the integration of this economic structure is, the more weaknesses it reveals.
Source: thesaigontimes
Compiled by VBI

